Two Different Savings Accounts For Two Different Time Horizons
7 min read.
We’re planning our finances for two time-horizons: the short/medium-term, so that we’re able to cover foreseeable big expenses (car, vacation, house, wedding, etc.), and the long-term, to fund our retirement on top of our State retirement pension. These two time-horizons have different demands on how easy and cheap it is to withdraw from your savings accounts and how volatile the value of your savings can be.
For example, when you’re going to pay for your wedding, you want to be able to withdraw from your savings easily, and when you do, you don’t want to be surprised by the fact that, due to a sudden stock-market crash, your savings are now worth 30% less than a month ago, and therefore your soon-to-be wife will have to walk down the aisle in a t-shirt and jeans. To prevent this, for the short/medium-term, we’re going to invest in a regular fixed interest rate savings account. It’s free to withdraw money from it, you can do it overnight, and your capital (the money you put on your savings account) and your interest are (mostly) guaranteed.
I believe that most people will immediately agree on picking a fixed-interest-rate-savings-account for your short/medium-term savings. How you’re going to invest in the long-term, however, is not so consensual. And that’s because people differ in how averse they are towards risk, meaning how comfortable they are with events where their savings decrease (dramatically) in value. While less risk-averse people may immediately understand that, for the long term, it is wise to invest in assets with higher return potential even if they’re riskier, more risk-averse people will prefer to invest in safer alternatives even though their return potential is capped. The options that more risk-averse people tend to opt for in their long-term investments are again a fixed-interest-rate-account, real estate, or government bonds.
I am going to argue that if you’re more risk-averse, and therefore you don’t even consider investments that do not guarantee your capital, let alone your returns, that’s because you haven’t taken the time to properly examine your alternatives. You’re letting yourself be driven by the abstract sense that “I don’t want my savings to be at risk” without actually attempting to measure that risk and the potential returns that you’ll be missing out on by not considering the riskier, but higher-reward options.
You need to get your head on straight. It’s one thing to be conservative—if you’re afraid of losing money, you can pick investments that limit your exposure (…) But the more common problem is that you haven’t given investing much thought at all!
(…) Confusion and fear of losing money gets in the way. Let’s be clear: If you’re not investing, in the long term you’re losing money every day. It actually costs you money to park your money in a savings account as inflation eats into your earnings. (…) If you’re truly risk-averse, you can always balance your portfolio with more conservative investments. But don’t succumb to irrational fear and not invest at all. Ironically, the people who do that are the ones who end up without enough money in the end.
—Ramit Sethi, I Will Teach You To Be Rich
Ultimately, a big portion of this guide’s purpose is to make you challenge your risk-aversion and truly consider investing your savings to their real potential, according to your investment profile. I’ll go through all that I’ve learned in more than 100 hours of research and all the decisions I’ve made so that you can take this important step in the management of your finances as easily as possible.
Note
Still, I suggest that you read I Will Teach You To Be Rich because this guide and Ramit’s book are more complementary than substitutes. While I go into the detail of how to invest in the long-term, Ramit goes through all the thought process of why you should invest, why you should start investing early and will also explain how to manage your finances in general. In his words:
I Will Teach You To Be Rich is about taking the first step—understanding the barriers that keep us from managing our money—and then tearing them down and putting our money in the right places so we can achieve our goals.
—Ramit Sethi, I Will Teach You To Be Rich
You’ll see that you’ll be able to build an investment solution that fits your profile, one that feels right to you. That’s because I’m proposing investing in asset classes with different risk-reward profiles, and you’ll build the mix that offers the right balance for you. These asset classes are stocks, bonds, and shares in real estate (called Real Estate Investment Trusts, or REITs for short). Stocks are riskier than bonds, so your risk-aversion will determine how much stocks will weight on your total portfolio relative to the other asset classes.
The right mix between these asset classes depends not only on your profile but also your current age. If you’re investing early, with at least three decades away from retirement, you’ll be able to tilt more towards riskier assets, letting time cover the risk. But we’re getting ahead of ourselves. All this will be explained in the next chapter.
For now, let me conclude this point with some quantitative exercises.
Numbers That Show That The Stock Market Rocks For The Long Term
Let’s say that two people saved 200€ per month since the beginning of 1985 to April 2020 (inclusive). One put that money in the stock market, investing in the market as a whole through the MSCI World index (read about market indexes here). The other saved that money in a 1,50% real (inflation-adjusted) fixed-interest-rate savings account.
Here’s the difference of performance between the two approaches.
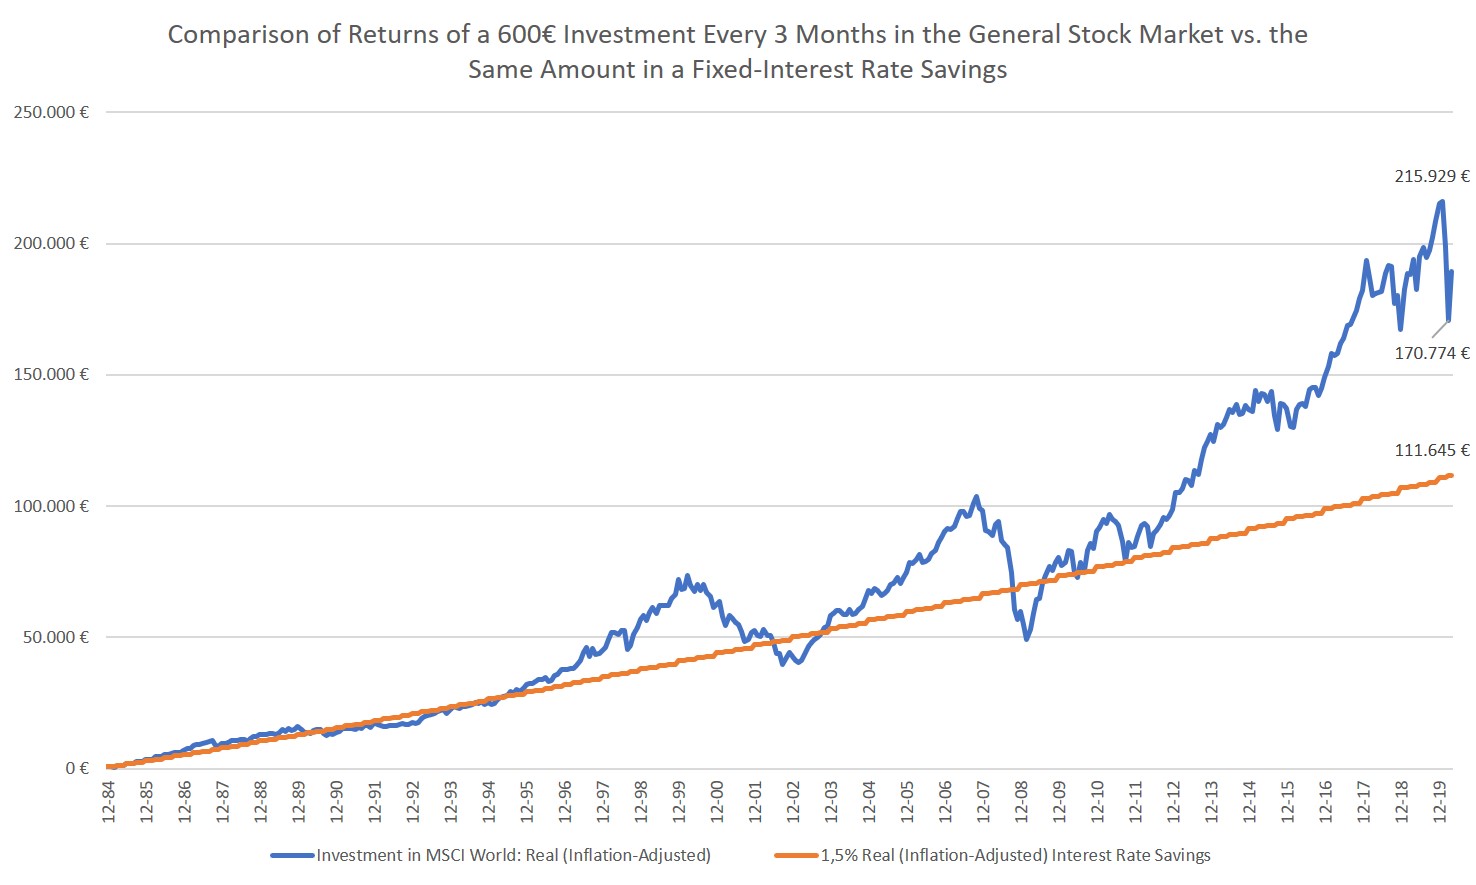
Note: We’ll discuss why analyzing performance data in real (inflation-adjusted) terms is better than using nominal data here.
It’s clear that investing in the stock market was clearly the right decision because it outperformed the 1,50% real fixed-interest-rate alternative every year except for the aftermath of the 2000’s and 2008’s crises, from which the stock market recovered relatively quickly. And when will banks offer us a 1,50% interest rate after inflation from a savings account again?
There’s another exercise that makes the difference between investing in the stock market for the short- and for the long-term clear. Let’s do it now.
The performance of an investment in the stock market is notoriously sensitive to start and end dates. From the graph above, you can see that the return rate of an investment made from early 2000 to early 2010 is significantly lower than the return of an investment from early 2003 to early 2010. Although in the second situation you’ve invested for a shorter period of time, you’ll get a significantly higher return rate because you’ve taken full advantage of the stock market recovery after the 2000’s crisis. You’ve bought low and sold high, which is everyone’s dream.
But the truth is that you can never foresee this in advance. When you’re buying, you don’t know how the market will perform after your investment. So, how to deal with uncertainty?
The important fact to learn is that the performance of an investment in the stock market is sensitive to start and end dates when you invest for the short/medium-term, and not so much when you invest for the long-term.
Let’s compute the Compound Annual Growth Rate (CAGR) (see definition here) for investments started in different years and held for different periods. The CAGR will measure how those investments performed, and so how sensitive they are to start and end dates.
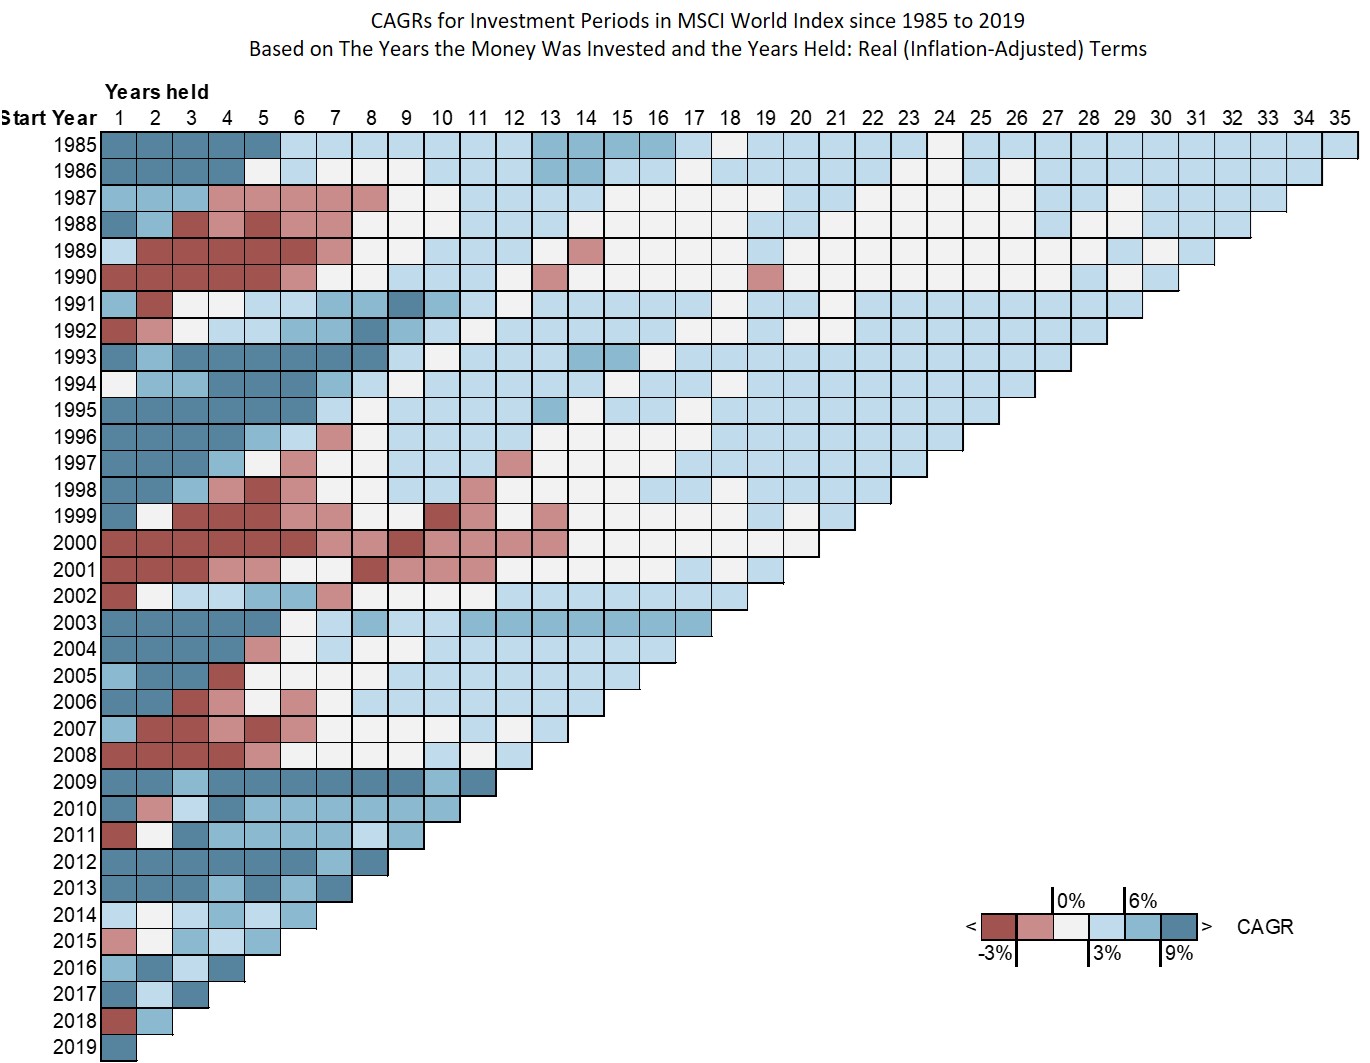
As an example of how to read the graph, if you had invested in the beginning of 1989 and held your investment for 30 years, your real (inflation-adjusted) CAGR would be 2,9%, which falls in the 0%-3% range. That means that, even though you’ve experienced different performances throughout that period – in fact, your investment’s real value was below what you put in for the first 7 years – the returns you got in the end are equivalent to what you would have got if your investment had consistently grown 2,9% every year during those 30 years. Check for a full explanation on how heat maps work here.
It immediately stands out that the higher CAGRs (both positive and negative), which indicate a higher volatility and, therefore, a higher exposure to risk, occur for investments held for 10 years or less. For investments held for a longer period, in particular for longer than 15 years, CAGRS tend to fall between more moderate values, somewhere between 0%-6%. Note that these are real (inflation-adjusted) values, which make them great.
Download the excel used to make these exercises here: msci-world-for-the-long-run.xlsx.
Note
One important side-note that, no matter how many times I repeat it, I won’t repeat it times enough. Past performance is no guarantee of future results. Please don’t take the data above and expect to get those returns in the future. No one can predict how your returns will look like.
(A quick Google search of the phrase will immediately show you that it is mandatory to include this disclaimer in all investment literature.)
So let me conclude once more: the fact that the stock market is volatile should not hinder us from investing in it in the long-run.